Front Porch Blog
Updates from Appalachia

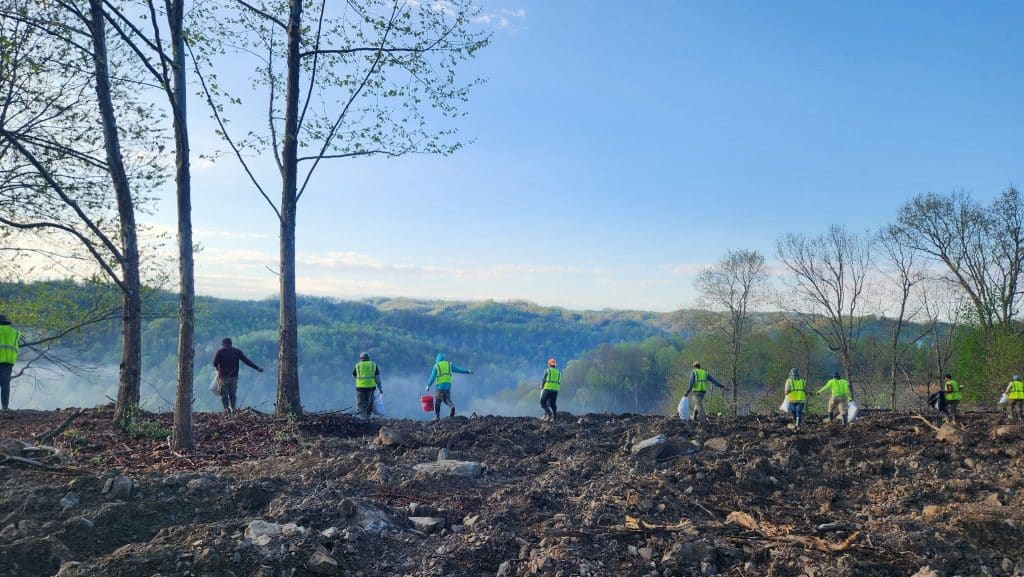
Transforming a former mine into a healthy forest
Appalachian Voices acquired Quarry Drive, a 193-acre former coal mine site to restore a healthy native hardwood forest that supports local wildlife, steward the land and explore ways to fund mineland restoration at a larger scale.
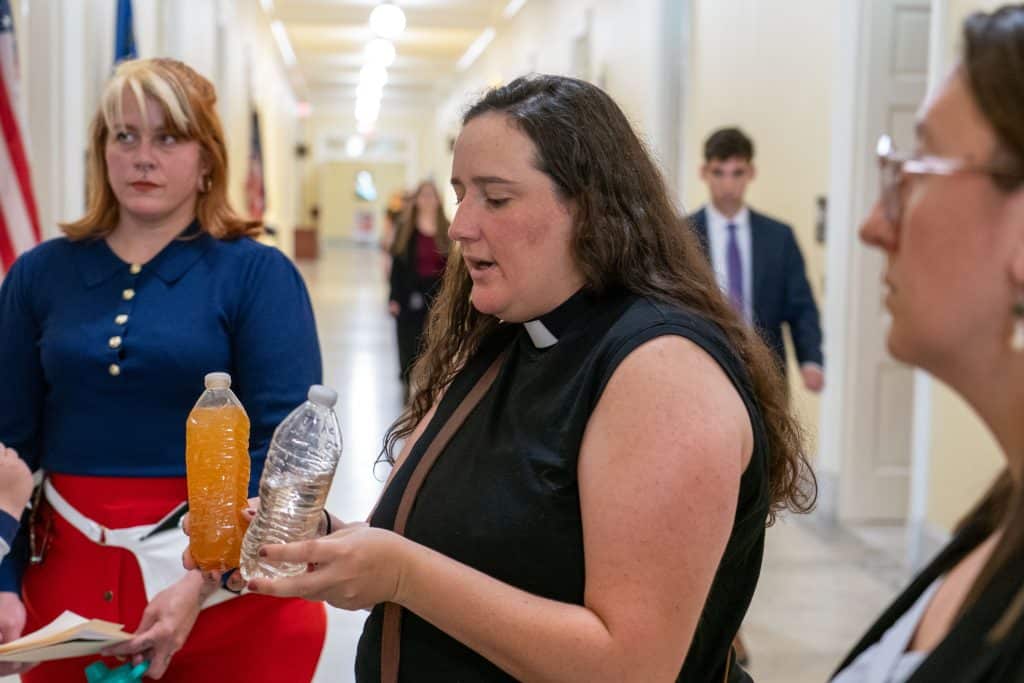
Clean water is overdue in West Virginia’s coal country!
Advocates met with congressional staff on Capitol Hill last week to ask for vital water infrastructure investments in West Virginia. Sen. Capito and Rep. Moore are key parts of the process.
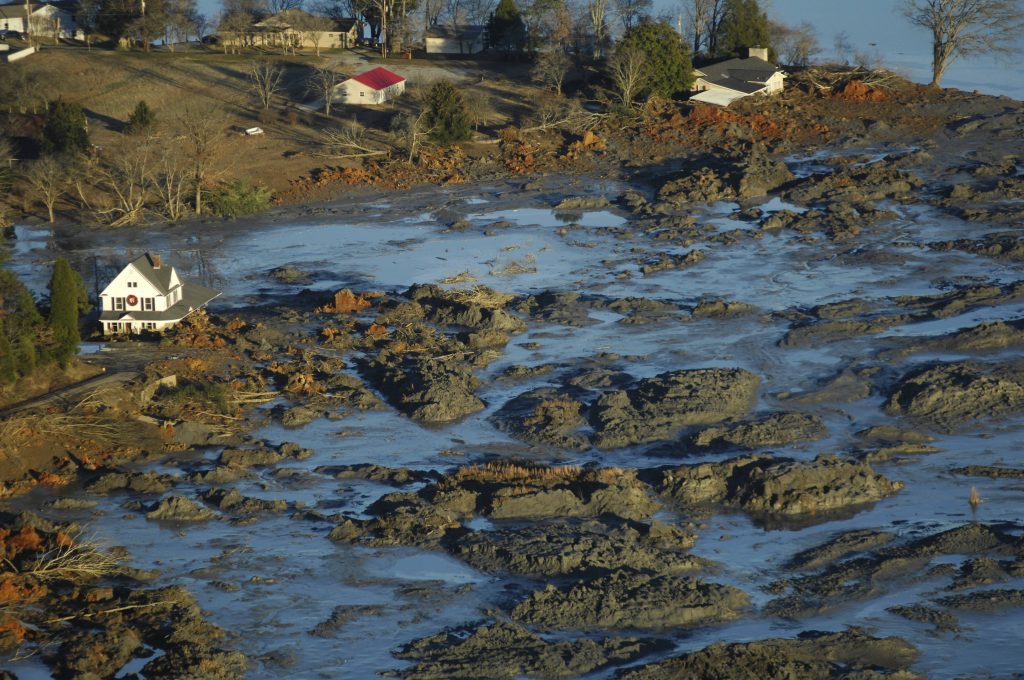
East Tennessee communities paid a high price to win federal protections from coal ash. Now the EPA is rolling them back.
Hundreds of communities across the country have been harmed by coal ash pollution, and each one has a story about its fight for protections from this nasty and harmful industrial waste.

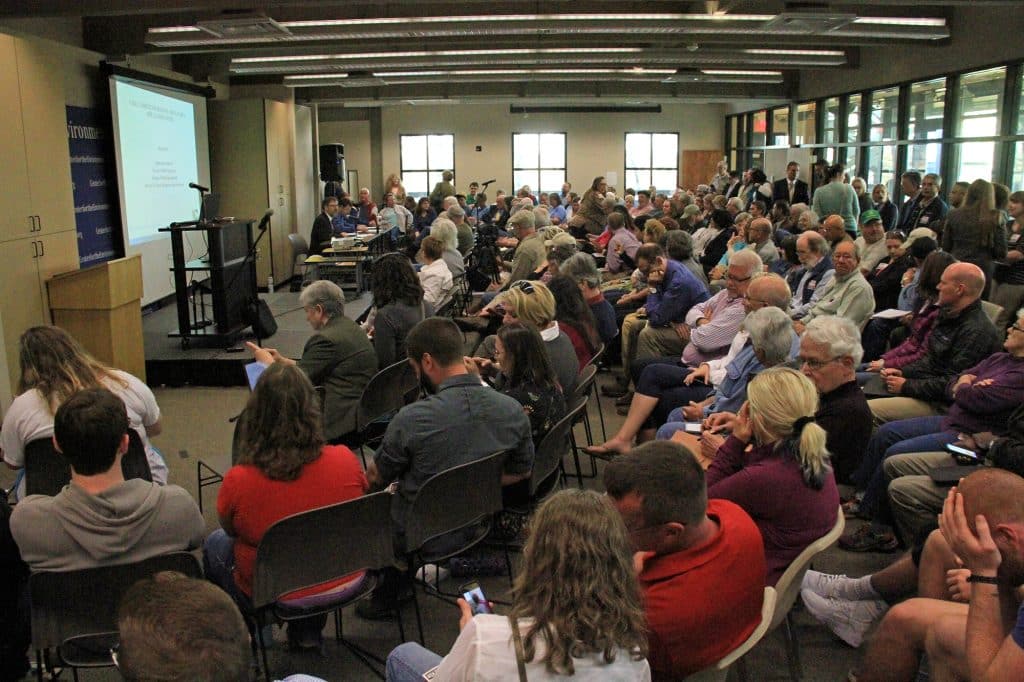
Who gets what, when and how: What the congressional appropriations process means for Appalachia
Congress is kicking off the annual appropriations process, where legislators decide whether to sustain or slash programs that support economic development, disaster preparedness, mine safety, environmental remediation and more.
Inside recent efforts to cut the public out of government decision-making and weaken NEPA
Further weakening a key environmental protection law will not speed up infrastructure projects.