Front Porch Blog
Mapping the decline of coal production
An abandoned coal tipple in Wise County, Va. Photo by Jimmy Davidson.
What MSHA coal production data tells us about Appalachian mining trends
The decline of coal production in Appalachia has been ongoing for decades. We thought it would be useful to develop a way to visualize these trends across the region. Using data compiled by the U.S. Mine Safety and Health Administration and an algorithm we developed to process that data, we created an interactive map showing what is happening with coal production in Appalachia.
The Mine Safety and Health Administration has long served as the frontline agency protecting workers in America’s mining industry. While its primary mission focuses on safety and health regulations, MSHA also maintains one of the most comprehensive datasets available on U.S. coal production. This includes annual reports from every permitted coal mine in the country — tracking everything from tonnage to employment hours to the name of the closest community. MSHA’s data often lists the “nearest town” to the mine site, which is a helpful, if imperfect, way to geographically link mining activity to communities. While this may not always reflect the exact physical location of the mine, it provides a consistent naming convention that allows us to analyze local mining trends across Appalachia which might get lost in broader analysis.
Every mine operator is required by law to submit regular production reports to MSHA, ensuring federal oversight of both safety and mining activity. These reports provide crucial insight into where coal is being extracted, how much is being produced and under what conditions. For communities and researchers alike, this is invaluable information, especially as the coal industry faces economic headwinds in a rapidly shifting energy landscape.
To better understand local and regional mining patterns, we developed an algorithm that processes MSHA coal production data between 2014 and 2024. Here’s how it works:
- Cleaning and Filtering: We organize the data by town, county and state, aggregating the data at the town level
- Trend Analysis: Using statistical methods, we calculate a linear trend (or “slope”) in coal production over time for each location.
- Quality Assurance: We then identify and merge as needed any town names that have multiple spellings due to typos
- Geocoding: We convert town and county names into latitude and longitude coordinates using the Google Maps API, allowing us to visualize them on a map.
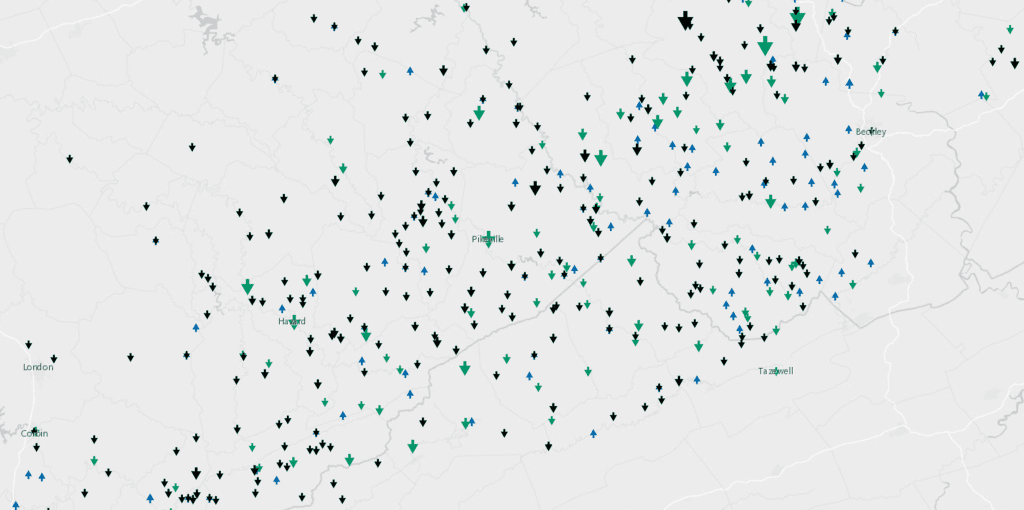
- Mapping: Each town is color-coded — blue for increasing coal production, green for declining and black for no reported 2024 production. Each town is also portrayed with an up or down arrow denoting increasing or decreasing production, that is scaled in size to proportional to the production in Appalachia.
This is all visually presented on a map to make all the information easier to digest.
The results are stark: In some towns, coal production has fallen dramatically. Norton, Virginia, for example, has experienced a cumulative decline in coal production of over 700,000 tons, with production dropping to nearly zero by 2024. More than half of the listed locations now show zero production for 2024, reflecting deep structural changes in the coal industry and shifting market dynamics.

Compounding the issue is the growing presence of “zombie mines” — abandoned or idled mine sites that remain unreclaimed and unmanaged. These mines, while no longer active, often continue to impact surrounding communities through degraded water quality, erosion and potential pollution from failing sediment controls. In some cases, operators havegone into bond forfeiture, declared bankruptcy, or both leaving state or federal agencies with the burden of reclamation.
Many of the towns marked with downward black arrows — which indicate no coal production in 2024 — reflect this troubling pattern: modest output in earlier years followed by no production. In many of these places, the associated mines may be abandoned or idled, raising serious concerns about long-term land use, environmental justice and the mounting costs of unreclaimed sites as coal fades from the regional economy.
While production of metallurgical coal used in steelmaking has received recent federal subsidies, there’s little evidence yet in this data to suggest a significant uptick in production tied to those investments. Continued monitoring will be needed, especially as new infrastructure or international demand potentially shifts these dynamics. We intend to update this map and trends to see if such policies make a difference in the coal being produced. At the state and regional levels, coal production trends all go downward. But a few pockets of blue on the map show where coal coal production is increasing locally.
Coal’s legacy in Appalachia is profound, but its production footprint is shrinking. By visualizing these trends over time and space, we gain insight not just into the industry’s past, but also the urgent work required to shape the region’s future — economically, environmentally and equitably.
PREVIOUS
NEXT

Leave a comment
Your email address will not be published. Required fields are marked *
Leave a Comment