
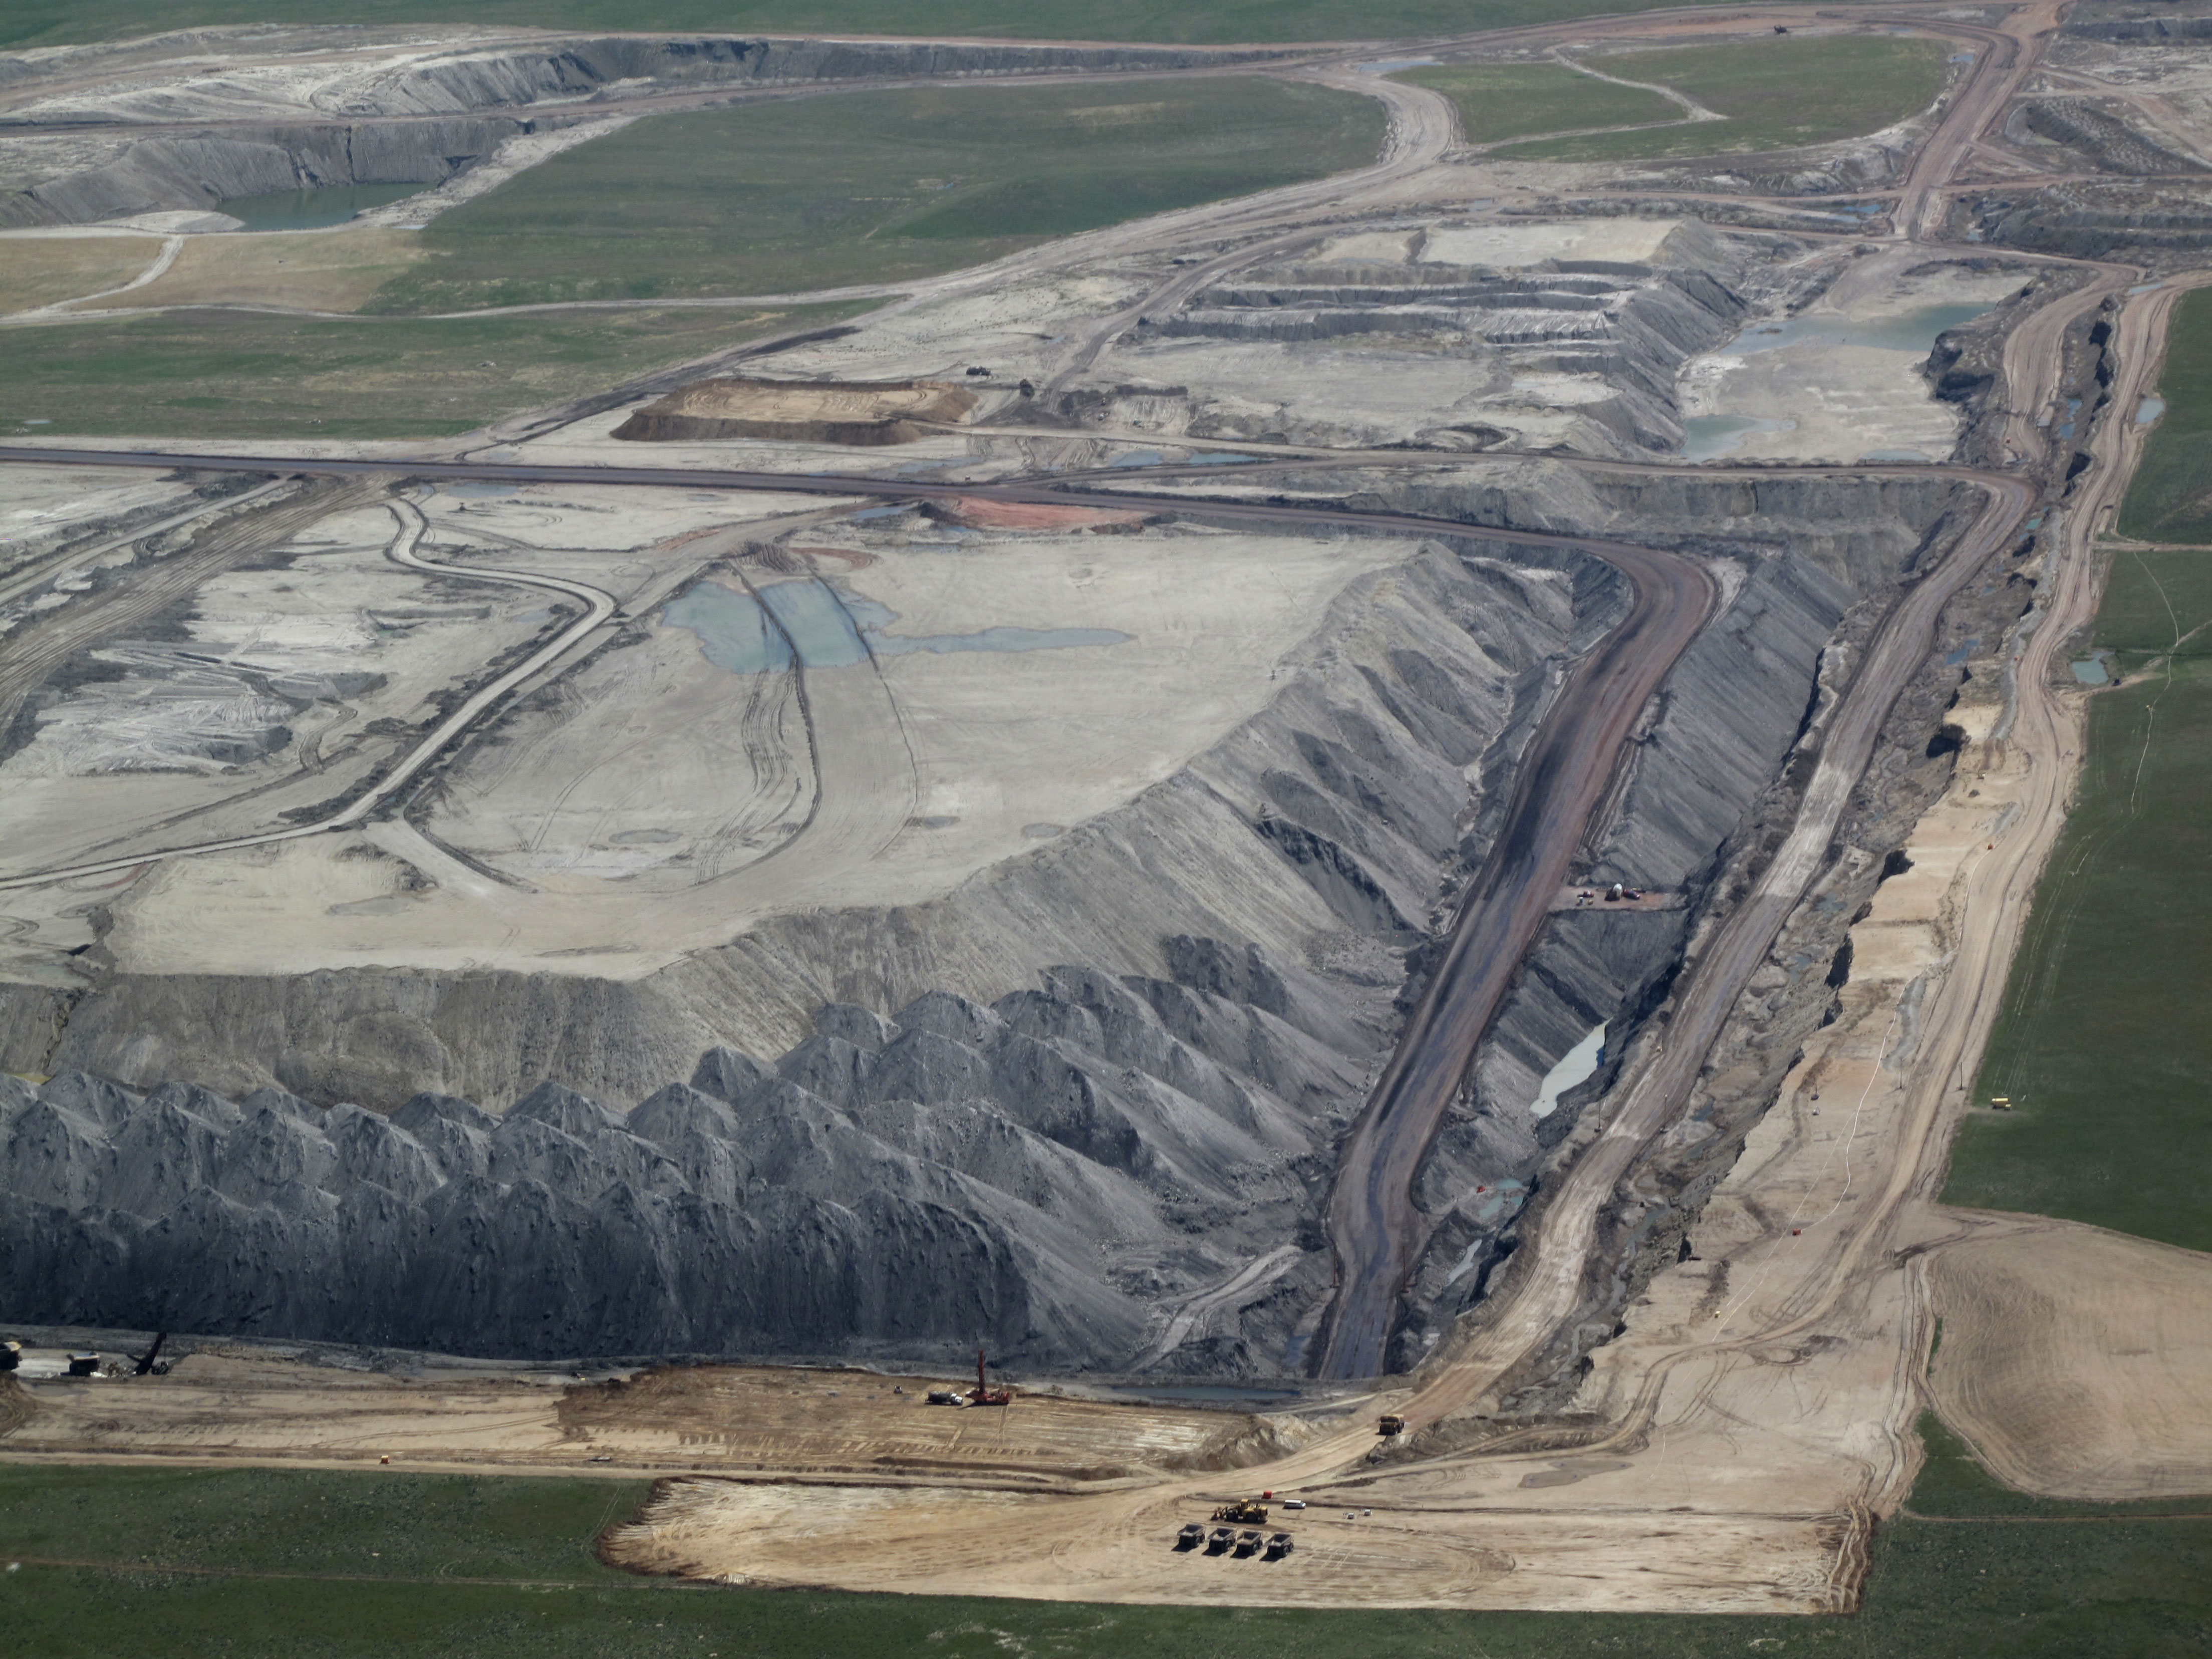
The Black Thunder coal mine owned by Arch Coal, near Wright, Wyoming in the Powder River Basin. Photo by EcoFlight
This report is the result of a collaboration between Appalachian Voices and the Western Organization of Resource Councils to assess the effect of Trump Administration policies on economic growth in coal-producing regions.
By Colin Lauderdale & Erin Savage
One year into the Trump administration, the coal industry that the president promised to revive has shown some muted signs of life. Nationwide, coal production ticked up last year for the first time since 2014, and the sector added 1,035 jobs — an increase of 1.9%. (A Reuters analysis using preliminary data from the Mine Safety and Health Administration put the number at 771 new coal jobs in 2017.) The administration claims this uptick as evidence that their anti-regulatory agenda is having its desired effect.
Unfortunately for Trump and the coal industry, though, 2017 appears to be an outlier in which coal overperformed. The coal industry’s fortunes are tied to market demand, not regulatory actions, and the same factors that have depressed coal demand for the past decade — cheap and abundant natural gas, air quality concerns, and depleted reserves — are as present now as when Trump took office.
Many of the administration’s policy actions in 2017 were aimed at bringing coal jobs back to mining communities. In the name of restoring these jobs, the administration repealed the Stream Protection Rule, initiated repeal of the Clean Power Plan, rescinded a moratorium on new federal coal leases, discontinued a programmatic review of the federal coal leasing system, repealed a rule closing loopholes in federal coal royalties, empaneled a committee of fossil fuel advocates to steer federal mineral royalty policy, announced U.S. withdrawal from the Paris Climate Accord, and canceled a National Academy of Sciences study of the health impacts of Mountaintop Removal mining.
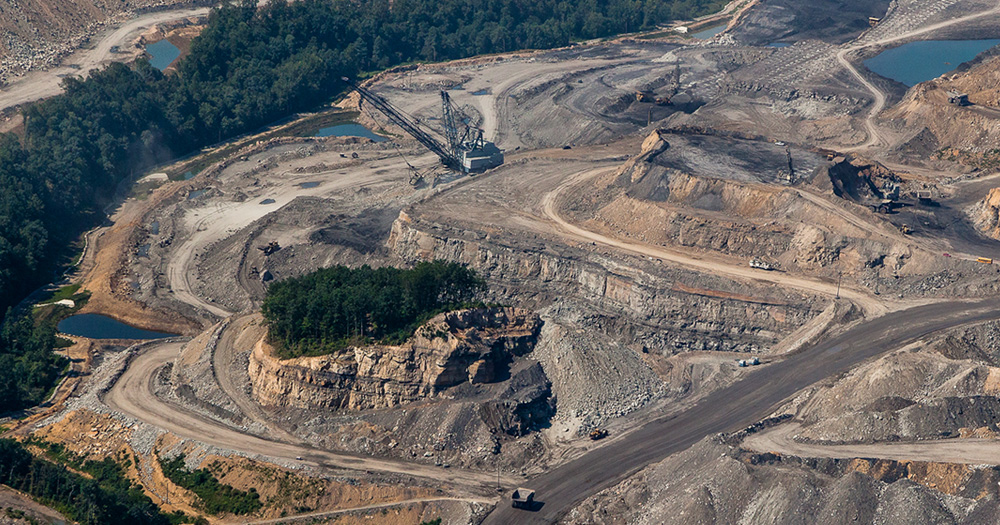
Mountaintop removal mine in West Virginia. Photo by Kent Mason
Energy Secretary Rick Perry also brought a rulemaking to the Federal Energy Regulatory Commission that would have subsidized aging coal-fired power plants with ratepayer dollars, but the commissioners voted down the plan unanimously.
These policy decisions have major implications for clean water, breathable air, public health, taxpayer fairness, fair electricity markets, and everyone impacted by global climate change. In addition, the data suggests that these policy actions aren’t likely to reverse the macroeconomic trends that have been working to depress coal’s value and market share.
These five graphs illustrate what happened with coal in 2017 and why the long-term trends in the industry are unlikely to reverse.
1. Production and employment went up, barely
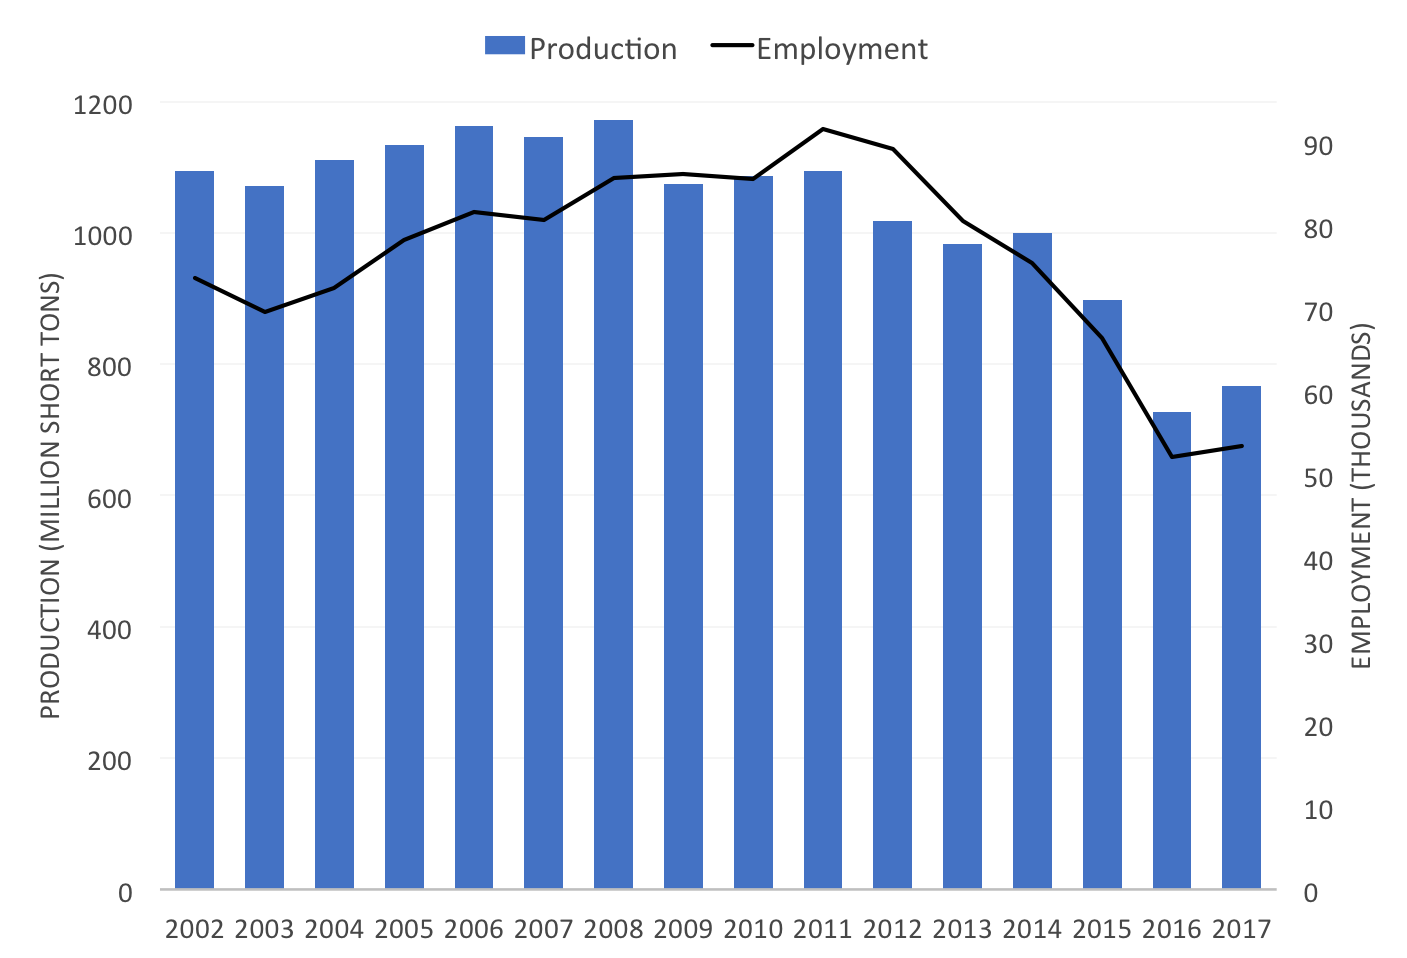
Figure 1. U.S. coal production (million short tons) and employment (thousand workers) 2002-2017. Source: MSHA Part 50, MSHA Open Government Data
2017 bucked a long-term trend in coal production as coal mining companies sold more tons of coal and employed more miners than the previous year. Both increases were marginal, especially considering that both metrics are about one-third lower today than one decade ago.
The modest recovery in coal production did not lead to a commensurate recovery in employment. Although coal companies mined and sold about 6% more coal in 2017 (an additional 40.4 million tons) than the year before, they only hired back about 2% of their workforce (1,035 jobs).
2. Mines with fewer workers accounted for biggest production increases
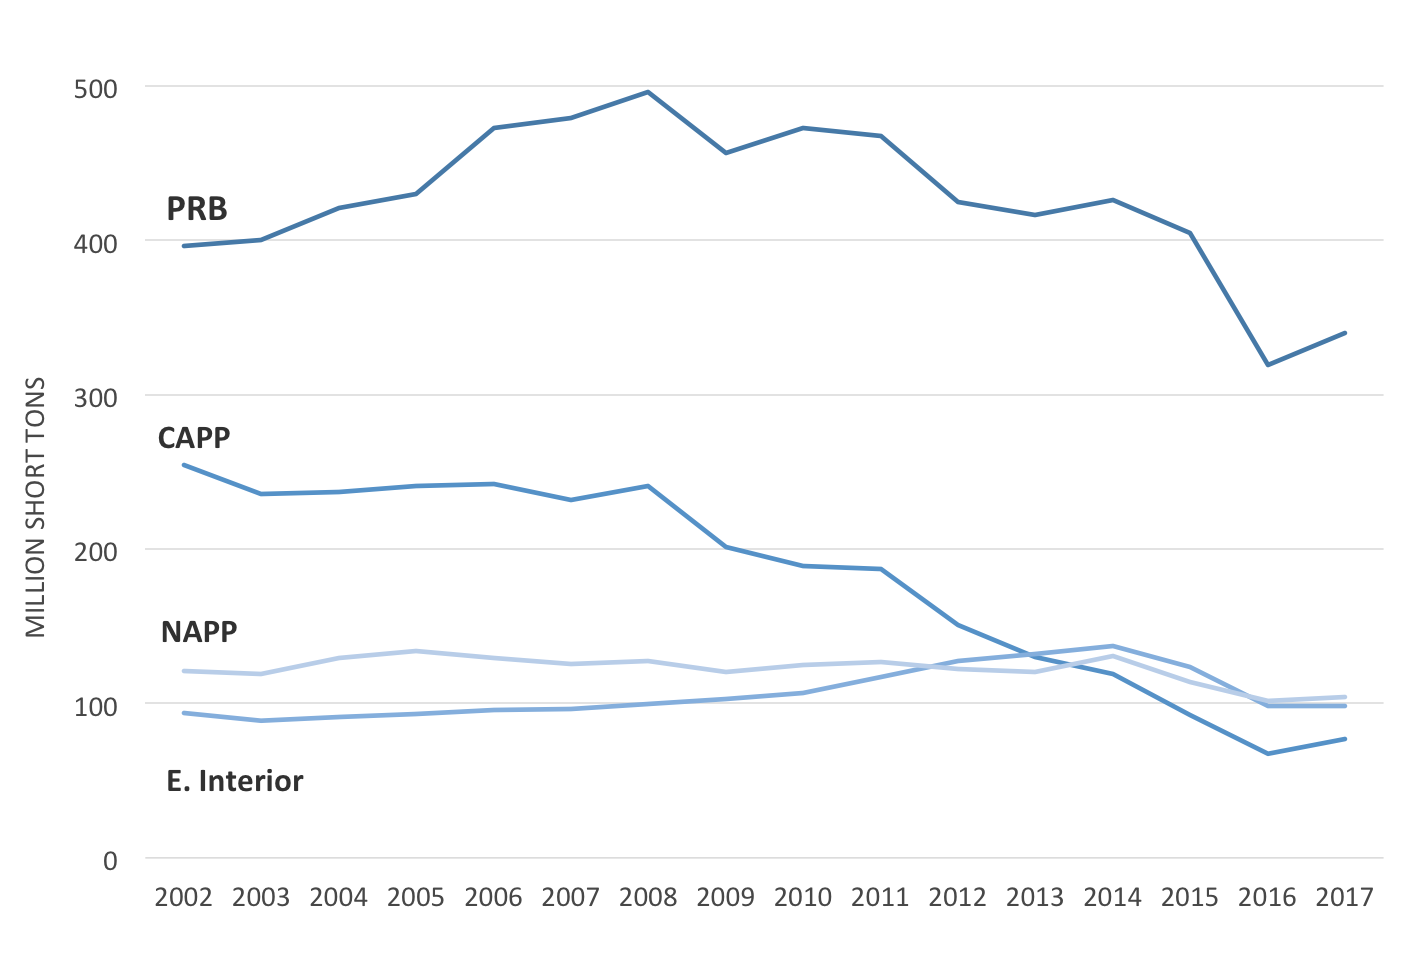
Figure 2. Regional production 2002-2017 (million short tons). Regions represented include the Eastern Interior (E. Interior), Central Appalachian (CAPP), Northern Appalachian (NAPP), and Powder River Basin (PRB) coal-producing regions. Data is preliminary for quarter 4, 2017 and production could increase slightly. Source: MSHA Part 50, MSHA Open Government Data
Almost half the coal mined in the U.S. comes from the Powder River Basin (PRB) of Wyoming and Montana, where large surface mines and thick coal seams allow companies to produce coal with fewer workers than mines in Appalachia and the Illinois Basin. This explains why net gains in employment in 2017 did not keep pace with net gains in production. Despite accounting for 51.9% of the increase in U.S. coal production from the year before, the PRB actually lost about 60 jobs in 2017.
3. Consumption decreased (again)
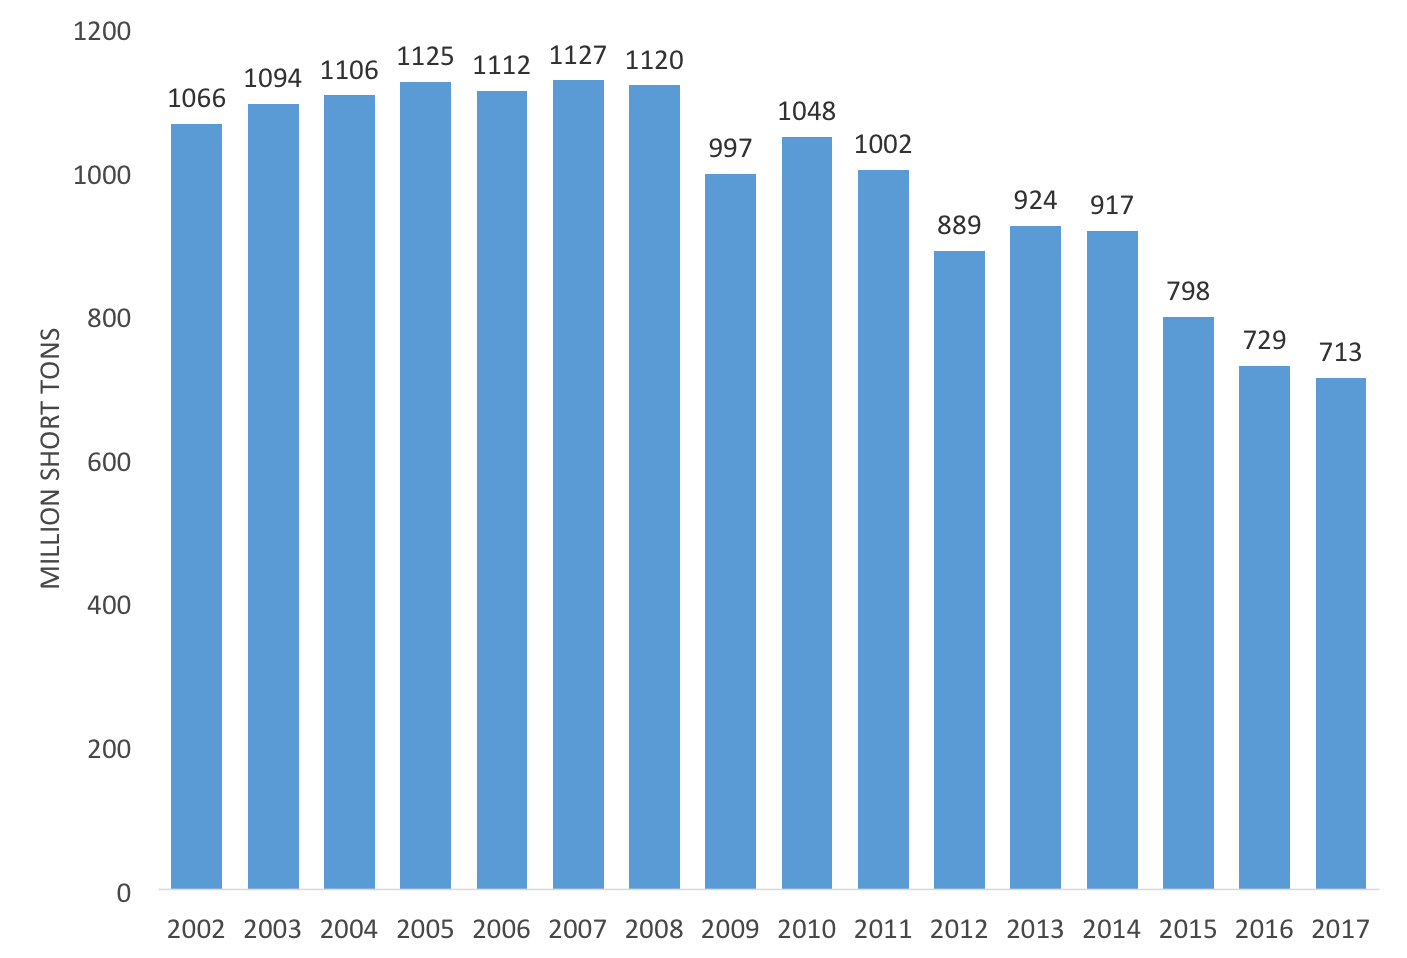
Figure 3. U.S. coal consumption 2002-2017 (million short tons). 2017 consumption estimated by Rhodium Group analysis. Source: EIA, Rhodium Group.
Despite increases in both production and employment, the long-term trend of decreasing domestic demand for coal continued in the first year of the Trump Administration. Last year was the fourth consecutive year of falling domestic demand and marked a 37% decline from a decade ago. The continued decline comes from the rolling wave of retirements of coal-fired power plants, coal-to-gas switching at utilities across the country, increasing generation from non-hydro renewables, and a complete lack of new coal-fired electricity generation in the U.S.
This trend is likely to continue. According to the Energy Information Administration, 14 gigawatts of coal-fired electricity generating capacity are scheduled to come offline in 2018, with no new coal generation to replace it. The Energy Department’s short-term energy outlook predicts that 2018 will be the first year in modern history in which coal provides less than 30% of the nation’s electricity.
4. Exports made up the difference
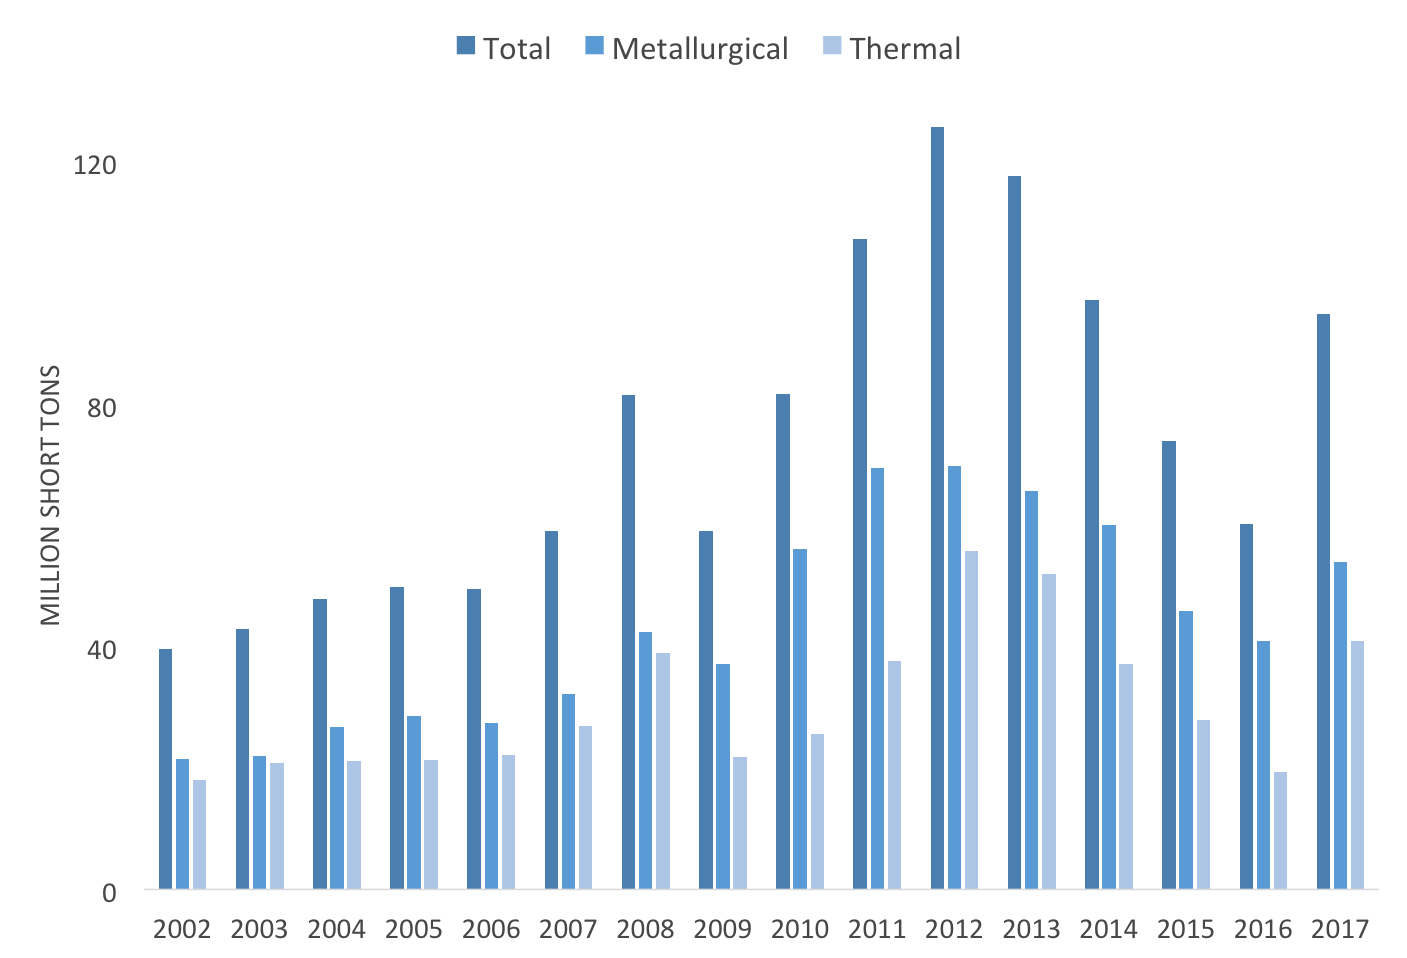
Figure 4. U.S. Coal Exports 2002-2017 (million short tons). Source: EIA
If mines produced more coal in 2017, but Americans used less of it, where did the excess go? The answer is overseas. Last year saw a spike in coal exports, from 60.3 million short tons to 95 million. In the first ten months of 2017, exports were up 70% over the same period in 2016.
The spike was driven by rising international prices for metallurgical coal (used for steel production rather than electricity) that accompanied strong international economic growth last year. Metallurgical coal shipments accounted for 43% of coal exports in the first half of 2017, with most of the economic benefit accruing to West Virginia producers.
Exports of steam coal for electricity also increased due to seemingly temporary factors in the Pacific Rim. The Asian market for coal swelled as China, the world’s largest coal consumer, increased imports while decreasing domestic production due to safety inspections and closure of inefficient Chinese mines. U.S. producers were able to grab a portion of this market after Cyclone Debbie shut down coal mines and railways in Australia, effectively halting Australian exports that usually crowd out American coal in the region.
5. Coal companies stopped pursuing 1.97 billion tons of new federal coal leases
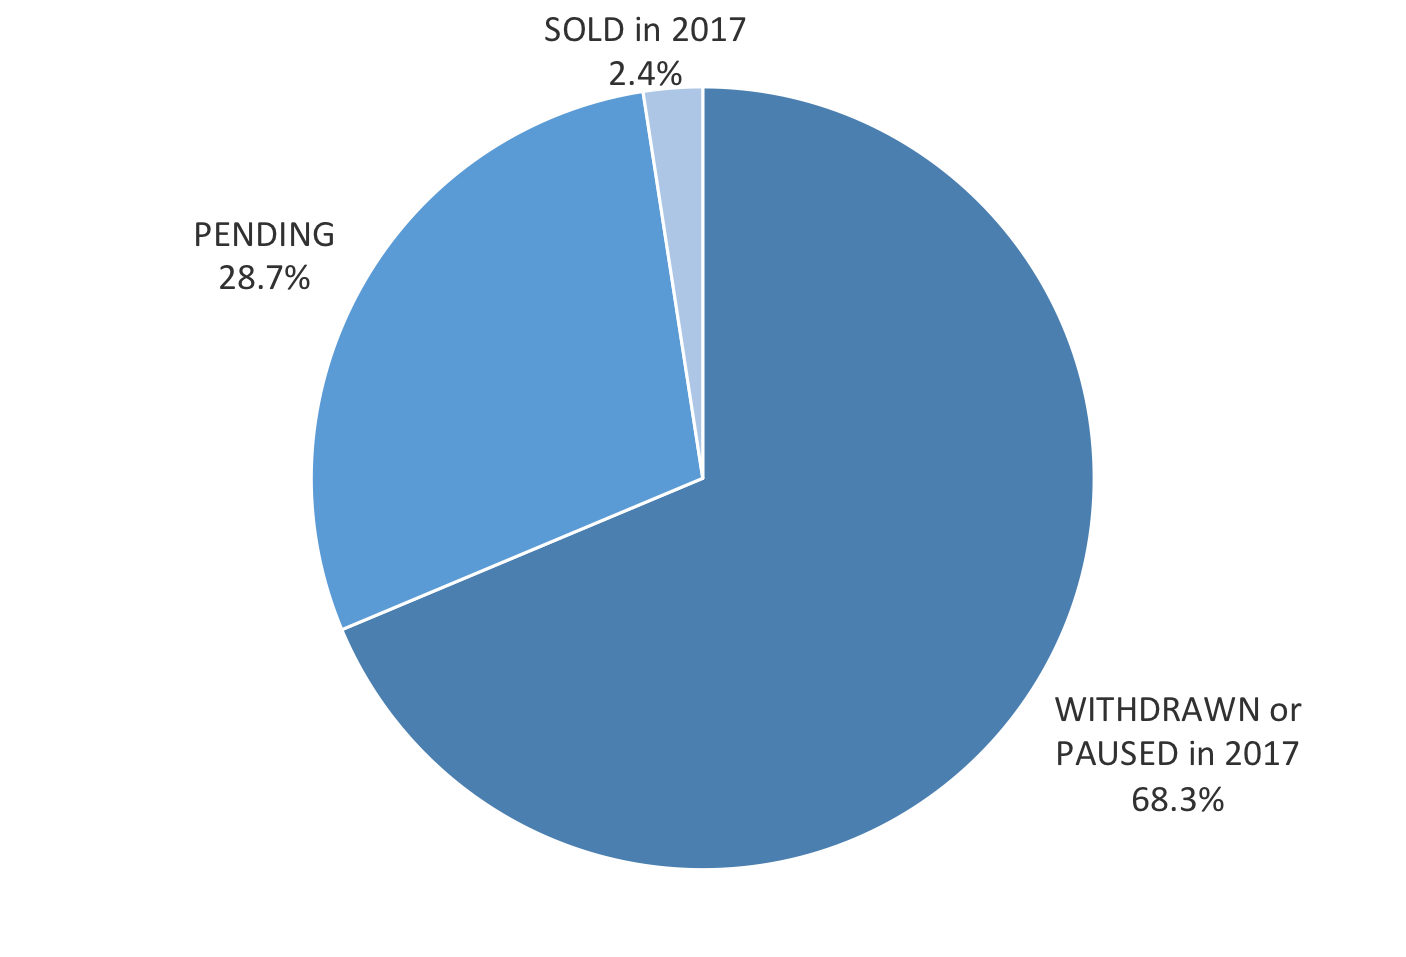
Figure 5. Current status of federal coal leases pending before Trump took office. Leases are considered “paused” when a company has (i) requested that the Bureau of Land Management (BLM) stop processing the lease, (ii) failed to provide additional information or payment required for BLM to process the lease, or (iii) not responded to BLM inquiries about continuing to process the lease. Source: Bureau of Land Management, LR2000
Early in 2017, the Trump Administration terminated two policies implemented by the Obama Administration in January 2016: a top-to-bottom review of the financial and climate implications of the federal coal leasing program, and a temporary moratorium on new major federal coal lease sales. Interior Secretary Ryan Zinke ended both the review and the moratorium with a Secretarial Order last March, declaring that both had prevented the coal industry from flourishing.
Coal owned by the federal government accounts for over 40% of U.S. production. There was almost 2.9 billion tons of federal coal pending when Trump took office. Since then, only three federal coal lease sales have occurred, accounting for about 60 million tons, or 2.4% of the tonnage pending. All three leases would have been allowed under both of the terminated Obama-era policies.
Almost 70% (1.97 billion tons) of the tonnage pending has been withdrawn or put on hold by the companies that asked BLM to sell the coal in the first place. These actions are a clear indication that the coal industry, at least, doesn’t believe that the minor uptick in production in 2017 is the beginning of a rebound in coal’s long-term prospects.
In addition, last year saw one new 640-acre request for a federal coal lease in North Dakota, as well as relinquishment of a 5,226-acre parcel previously leased in Wyoming.
Conclusion
Although we share the president’s intention to bring economic prosperity to coal-producing regions, we believe his strategy of de-regulating coal mining and burning is unlikely to produce the forward-looking economic prosperity that coal regions need. The economic headwinds facing the coal industry are the result of competition from less expensive energy sources, depleted coal reserves that are more expensive to mine, growing consumer and business demand for cleaner sources of energy, and a carbon-constrained world. Until the administration is able to solve these problems, doubling down on the economic potential of the coal industry is a poor policy for promoting economic growth.
Coal communities deserve policies that take advantage of the coal regions’ existing assets; ensure the strongest possible standards for reclamation bonds; focus on creating new, sustainable, and diverse local economies; recognize mine reclamation as an economic opportunity; and preserve the benefits and respect that coal miners and their families have earned over generations of hard work powering our country.
Colin Lauderdale is the Washington, DC Representative for the Western Organization of Resource Councils.
 Erin Savage
While Erin prefers to be on rivers rather than at a desk, as our Central Appalachian Program Manager she devotes a lot of time delving through data to make it meaningful to others who care about the health of our waterways.

Thanks for all the work that Erin, Colin, and App Voices are doing.
https://www.journalnow.com/opinion/columnists/harvard-ayers-a-bad-pipeline-decision-for-north-carolina/article_dbdfdaf0-0778-11e8-a4e0-eb083693a448.html
https://thinkprogress.org/methane-leaks-erase-climate-benefit-of-fracked-gas-countless-studies-find-8b060b2b395d/
Continue the hard work of making coal companies replant trees and keep the streams and rivers free of ash and coal mining by products. All people And animals have a right to clean water and products taken from them to be pollutant free.
Hey, you said that there are “depleted coal reserves.”
How many reserves are depleted and where are they? How much coal is left in Kentucky, West Virginia and Pennsylvania as of the end of this year? I thought there was plenty.
I am 38 years old and hope I don’t live to see the end of coal as a fuel source for steam locomotives on tourist railroads.
Since coal is a non-renewable resource, we’re depleting any coal reserves we mine. The Energy Information Administration provides good resources on coal reserves, but there is not a good single answer. The last estimate of all reserves was done in 1975. There is certainly lots of coal left underground, including in Kentucky, West Virginia and Pennsylvania, but the remaining coal is often more expensive to mine because it is more difficult to reach.