Researchers at the University of Maryland have just released the first high-resolution map of global forest change in the 21st century. University of Maryland Professor of Geographical Sciences Matthew Hansen and his team published “High-Resolution Global Maps of 21st-Century Forest Cover Change” in the scientific journal Science last week. The project uses Landsat data, satellite imagery collected by the United States Geological Survey. A Google Earth Engine team created the map through high performance processing of geospatial data, to complete a time-series analysis of over 650,000 images to characterize forest extent and change between 2000 and 2012.
The online map provides imagery in a series of colors to document forest loss and gain. The accompanying article covers some expected and well known trends – deforestation of portions of the tropics from timber harvest and clearing for agriculture, as well as forest change in boreal forests from forest fire. Overall, the world lost 2.3 million square kilometers of forest between 2000 and 2012, but gained 800,000 square kilometers elsewhere, for a net loss of 1.5 million square kilometers.
The researchers noted one prominent trend in the United States: the disturbance rate of forests in the Southeast was 4 times that of the South American rainforest. In this case “disturbance rate” includes both the loss and regrowth of forest. Several factors may contribute to this high rate of change. In several Southeastern states, pine plantations are grown and harvested on relatively short cycles – more like other crops than natural forest. Another reason for the high rate of change may be mountaintop removal coal mining.
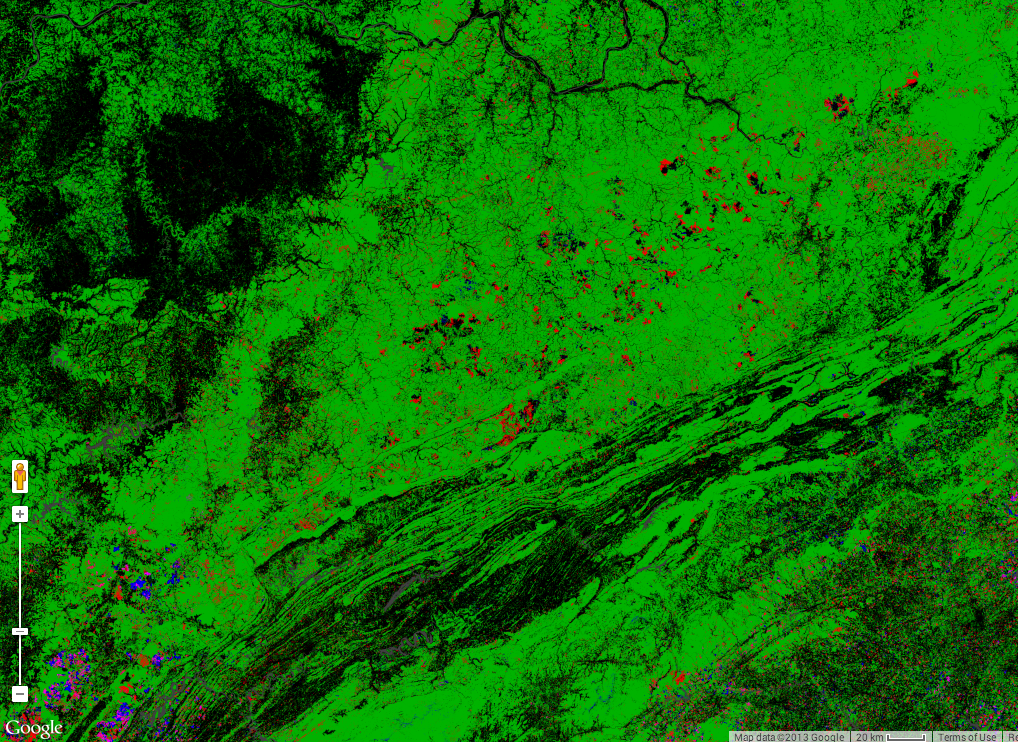
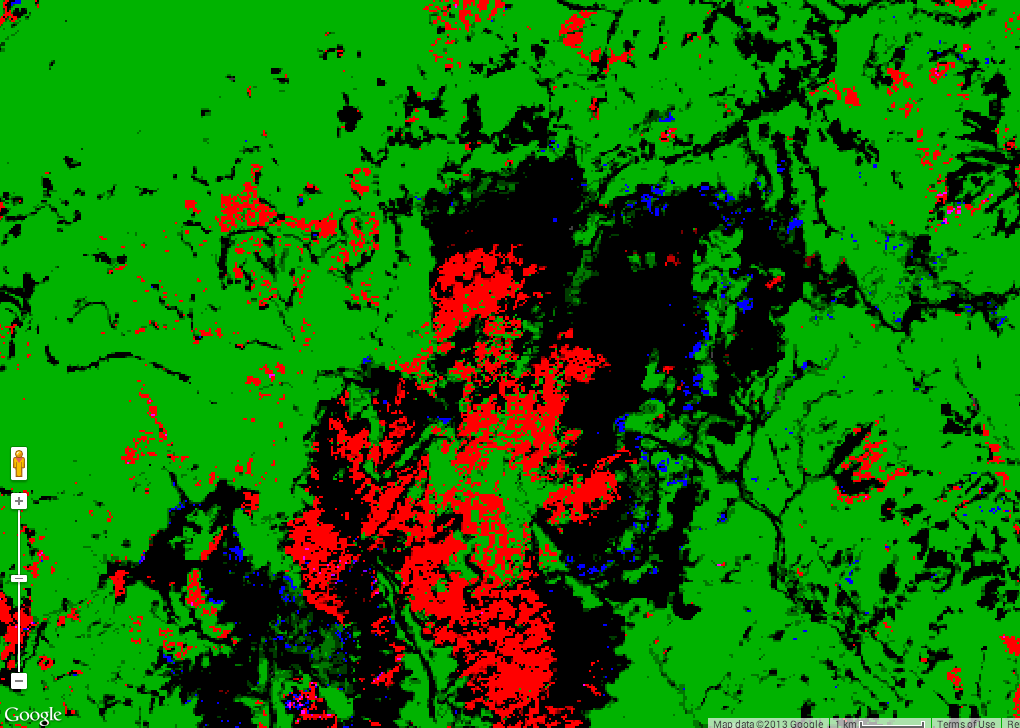
In the images below, forest change is mapped in Central Appalachia, including northeastern Tennessee, southwester Virginia, eastern Kentucky, and southern West Virginia. The red areas are areas of forest loss – in this area, the loss is largely due to surface mining. The black areas indicate area where no forest was present at any time between 2000 and 2012; in Central Appalachia these would be areas that have been surface mined, but never reclaimed to forested areas. (Click on the map to view a larger image, un-click “Data Products” to view the underlying location map.)

Forest change in Alabama – red is forest loss, green is forest gain, purple is a combination of loss and gain, and black areas are non-forested areas.
The image below is aerial imagery of a set of mines operated outside of Pound, VA by Red River Coal Company. Surface mines are easily visible via Google Earth.
The forest cover for this area is mostly black, indicating that this area has remained unreclaimed for more than 10 years.
Another study from earlier this year also addresses forest loss related to mountaintop removal coal mining. Researches at the University of Kentucky and the University of California have predicted that if mountaintop removal continues at its current pace, Central Appalachian forests will lose more than 30% of the carbon currently safely stored there.
The aerial and satellite imagery of mountaintop removal provides useful tools: from data analysis to identifying locations for citizen scientist to monitor water to providing local people with information about water contamination. It also provides a compelling visual reminder of the price of mountaintop removal in Central Appalachia.


Leave a Reply